Nagios Hacks
This page contains my modifications to nagios and nagiosgraph as well as my thoughts about open source monitoring.
After 10 years of power supplies going bad (usually due to heat), hard drives failing (usually due to heat), and UPSs bursting into flame (who knows?), I decided to get serious and monitor more information so I could catch things before they got bad. Previously I was using smokeping, cacti, and some hand-rolled perl scripts to monitor machines.
In December 2009 I evaluated many of the open source monitoring options and settled on Nagios. My first configuration was about 40 hosts and 400 services on a variety of operating systems and hardware spanning 3 networks. I spent about 4 hours getting the initial nagios system in place (from tarball), then about 8 hours tweaking nagios and getting nagiosgraph to work (also from tarball).
In February 2011 I did my 3rd production configuration consisting of about 50 hosts and 600 services. I spent about 30 minutes getting Nagios in place (including nagiosgraph), then a couple of hours getting all of the checks in place. The standard ones are trivial - most time was spent on unique checks, e.g. software license, individual server processes/services, etc.
In the summer of 2011 I did yet another nagios installation, this time in a remote location to monitor a range of hardware (electric power monitor, water use, weather conditions) with some rather tight resource constraints (plug computers, limited power budget, limited storage space) and harsh operating conditions (humidity from 10% to 99%, salt water spray, temperatures from -20C to +50C).
nagiosgraph 1.4.4 is much easier to install and configure than the nagiosgraph 1.3 I started with. A new install of nagiosgraph takes a few minutes (from rpm or deb) to a half hour (manually from source).
|
graphing and trending in nagios
|
Slides from the presentation "Graphing and Trending in Nagios", shown at the Nagios World Conference 2011 (HTML, PDF). The presentation explains why a history of performance data is needed, illustrates why trending is more than just creating graphs, outlines the moving parts in a Nagios installation (collection, storage, display), reviews the three add-on graphing options (nagiosgraph, n2rrd, pnp4nagios), and highlights some best practices and outstanding issues.
|
|
exfoliation
|
 Exfoliation is a skin for Nagios.
|
|
nagiosgraph
|
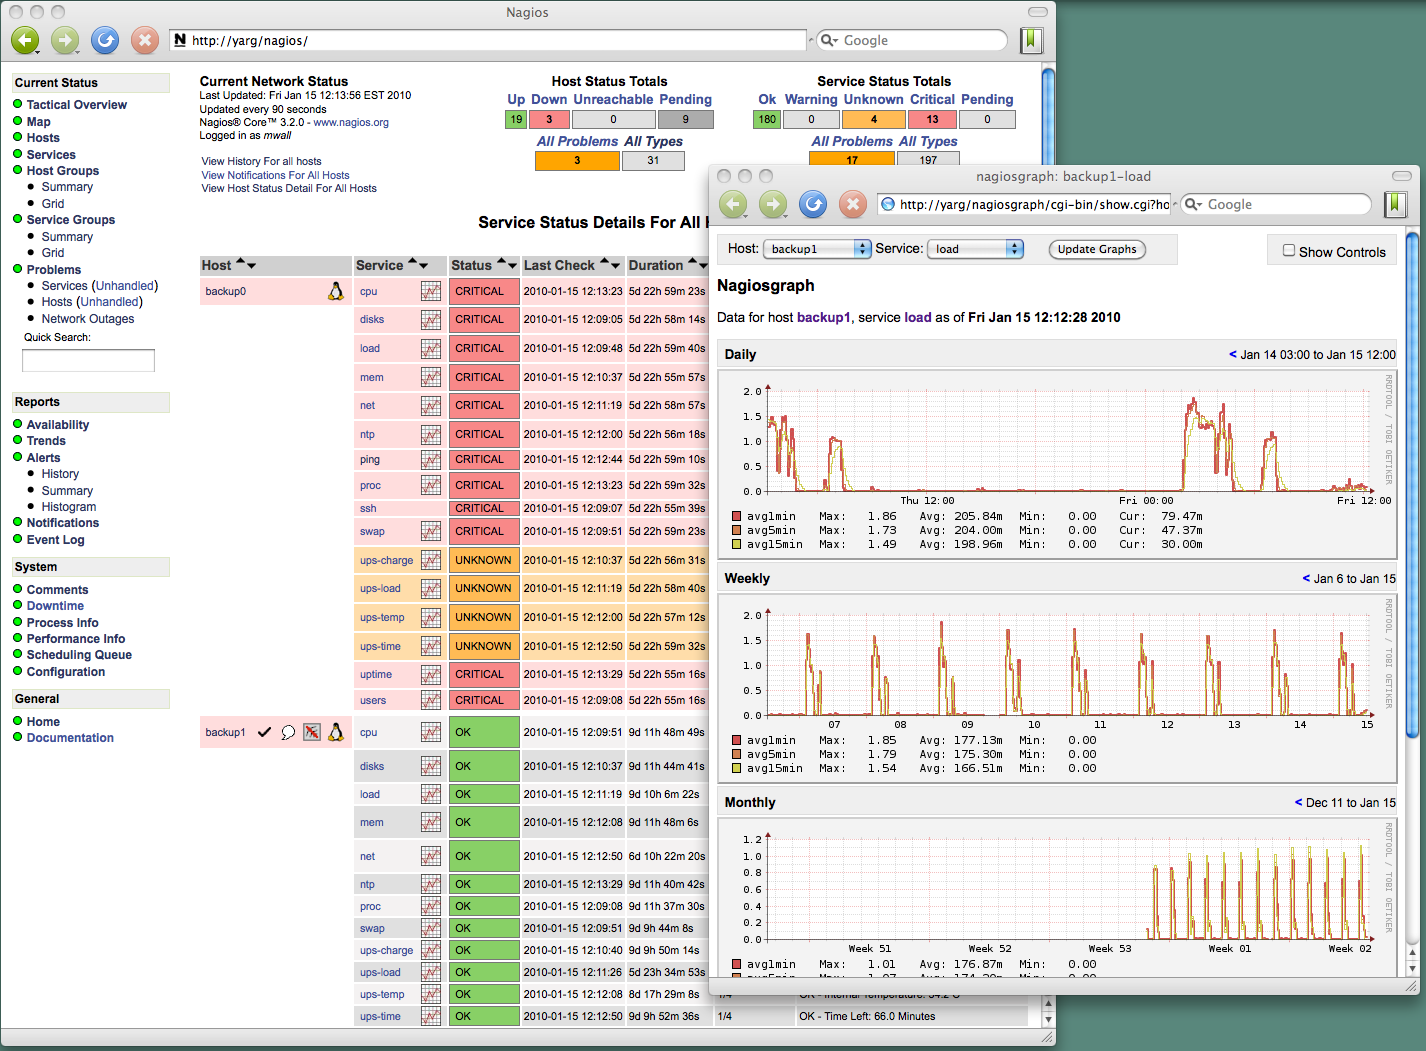 nagiosgraph is an add-on to Nagios that collects performance data into RRD files and provides a CGI interface for graphing those data.
|
|
plug-ins
|
These are plug-ins to Nagios that I have created and/or adapted.
|
Copyright © 2010 Matthew Wall, all rights reserved