
Examples
Home Intro How They Work Characteristics EXAMPLES
This page has been requested times.
![[t/s curve: (2.007) green maxon gearmotor]](gmaxonts.gif) The torque/speed curve to the right is for the green maxon geared D.C. motor used in a course at MIT:
2.007 Design and Manufacturing I.
The torque/speed curve to the right is for the green maxon geared D.C. motor used in a course at MIT:
2.007 Design and Manufacturing I.
![[green maxon motor]](gmaxonthumb.gif)
(green maxon motor)
![[Wn]](Wn.gif) = 600 rpm
= 600 rpm
![[Ts]](Ts.gif) = 0.325 N·m
= 0.325 N·m
![[W]](W.gif) = 300 rpm, and
= 300 rpm, and ![[T]](T.gif) = 0.163 N·m
= 0.163 N·m
![[t/s curve: (2.007) silver maxon motor]](tssmaxon.gif) The second torque/speed curve pictured here is for the silver maxon D.C. motor used in 2.007.
The second torque/speed curve pictured here is for the silver maxon D.C. motor used in 2.007.
![[silver maxon motor]](smaxonthumb.gif)
(silver maxon motor)
= 3750 rpm
= 0.0722 N·m
= 1875 rpm, and = 0.0361 N·m
![[t/s curve: (2.007) bosch wormgear motor]](boschts.gif) This torque/speed curve is for the bosch D.C. wormgear motor used in 2.007.
This torque/speed curve is for the bosch D.C. wormgear motor used in 2.007.
![[bosch wormgear motor]](boschthumb.gif)
(bosch wormgear motor)
= 92 rpm
= 1.6 N·m
= 46 rpm, and = 0.80 N·m
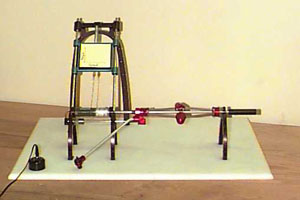
Here are some pictures and video clips of a clever device built here at MIT to illustrate how a torque/speed diagram represents
the characteristics of an actual motor.
Be sure to listen to the motor as the video plays.
You can hear the motor strain as it is slowed down.
As the motor spins, the red weights are pulled further from the motor shaft by centrifugal
force, which pulls the pen along the speed axis. As the experimenter slows the shaft down with her hand, the weights move in,
pushing the pen to the left. Meanwhile, a torque is being applied to the motor shaft by the person's hand in order to slow it
down. The motor is allowed to rotate, constrained by the spring attached to the plot area and the cable that wraps around the
motor. From Newton's third law, we know that every action has an equal and opposite reaction, so the motor rotates as the torque
is applied, pulling on the cable and moving the plot to draw torque on the vertical axis. Be sure to listen to the motor as it is
slowed down. The motor's tendency to rotate as the shaft is slowed down is the same as that of an electric screwdriver as it
rotates a screw. You have to hold the screwdriver firmly to keep it from spinning in your hand.
 Quicktime Video of the device as it is turned on, spins up to speed, is stalled out twice, and is tuned off.
(1.11 MB)
![[the device at rest]](cpeterzo1.jpg)
|
![[at full speed (no load)]](cpeterzo2.jpg) |
| 1. At rest (no rotation). | 2. At full speed (no load applied). |
![[loaded to about half speed]](cpeterzo3.jpg)
|
![[stalled out (max torque)]](cpeterzo4.jpg)
|
| 3. Loaded to about half speed. | 4. Stalled (maxium torque, no rotation). |
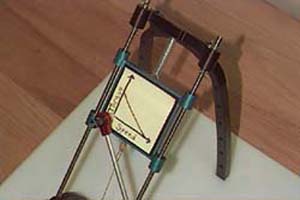 This video is a close-up of the plot area as the curve is traced by the machine as above.
(0.744 MB)
![[the device at rest]](cpeterzi1.jpg)
|
![[at full speed (no load)]](cpeterzi2.jpg) |
| 1. At rest (no rotation). | 2. At full speed (no load applied). |
![[loaded to about half speed]](cpeterzi3.jpg)
|
![[stalled out (max torque)]](cpeterzi4.jpg)
|
| 3. Loaded to about half speed. | 4. Stalled (maxium torque, no rotation). |
Below is the power curve for the green maxon motor pictured in the torque/speed section above. The yellow parabolic curve
is a plot of Power vs. Speed, and the white linear curve is a plot of Power vs. Torque. Recall that power is the product of
torque and rotational speed. As you can see from the plot, power is a maximum at the point on the torque/speed curve where
torque and speed are equal to one half of their maximum values.
![[power vs. speed curve for the GREEN MAXON motor]](torquepowerspeed.jpg)
| SI | English | ||||
|---|---|---|---|---|---|
|
1 m = 100 cm 1 m = 1000 mm 1 cm = 10 mm |
1 m = 3.280 ft 1 m = 39.370 in 1 cm = 0.394 in |
1 N = 0.225 lbf 1 N = 3.597 oz 1 kN = 1000 N |
1 ft = 12 in 1 in = 0.0833 ft |
1 ft = 0.305 m 1 in = 2.540 cm |
1 lbf = 4.448 N 1 oz = 0.278 N |
|
1 W = 1 N·m/s 1 kW = 1000W> |
1 W = 1.341E-03 hp 1 W = 0.738 ft·lb/s |
1 kg = 2.205 lb* 1 g = 2.205E-03 lb* 1 g = 0.035 oz* |
1 ft·lb/s = 1.818E-03 hp 1 ft·lb/s = 192 in·lb/s |
1 ft·lb/s = 1.356 W 1 in·oz/s = 7.06E-03 W 1 hp = 745.70 W |
1 lb = 16 oz 1 lb = 0.454 kg* 1 oz = 28.350 g* |
* when the acceleration due to gravity, g = 9.80 m/s^2 (g = 32.15 ft/s^2)
For an extensive reference on units, check out this site: http://www.unc.edu/~rowlett/units/index.html